
Tutorial: Threat Hunting Dashboard
Build a Foundry app that provides a threat hunting dashboard with interactive query widgets and an automated scheduled report delivered to your team.
What you’ll build
Section titled “What you’ll build”A Foundry app containing:
- A dashboard with multiple query widgets visualizing security data
- Saved LogScale queries for common threat hunting patterns
- A workflow template that automates scheduled reporting
Prerequisites
Section titled “Prerequisites”- Falcon Foundry entitlement
- Falcon Administrator or Foundry App Developer role
- Access to Falcon Next-Gen SIEM with data in your LogScale repositories
Step 1: Create the app
Section titled “Step 1: Create the app”- Go to Foundry > App manager.
- Click Create app > Start from scratch.
- Name the app “Threat Hunting” and click Create.
Step 2: Create saved queries
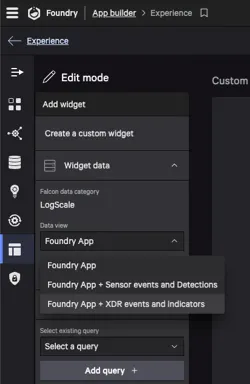
Section titled “Step 2: Create saved queries”In the App Builder, go to Queries and create three saved queries. For the data view, select Foundry App + Sensor events and Detections.
Suspicious DNS Queries
Section titled “Suspicious DNS Queries”Create a query that searches for high lookup counts to suspicious domains:
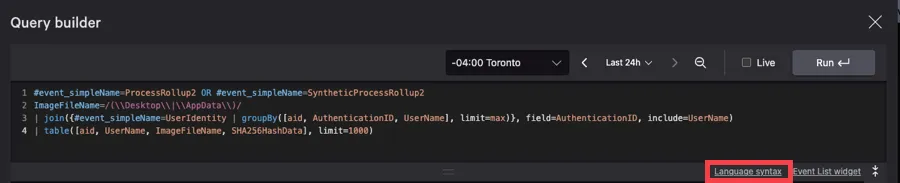
Process Execution in User Space
Section titled “Process Execution in User Space”Create a query that searches for process executions from user-writable directories. Use the query builder to write the CQL:
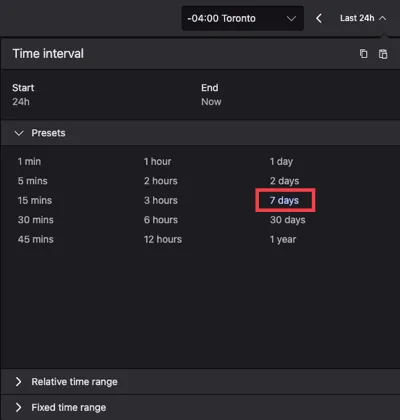
Set the time interval to 7 days using the presets panel.
Encoded PowerShell Commands
Section titled “Encoded PowerShell Commands”Create a third query that searches for encoded PowerShell command execution.
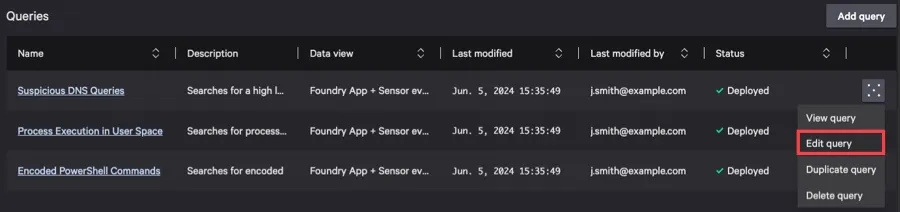
After creating all three queries, you can manage them from the Queries list. Use the actions menu to view, edit, duplicate, or delete queries.
Step 3: Create the dashboard
Section titled “Step 3: Create the dashboard”- In the App Builder, go to Dashboards.
- Click Create dashboard.
- Name it “Threat Hunting Dashboard”.
Add widgets
Section titled “Add widgets”Click Add widget to add query-powered widgets to the dashboard canvas. For each widget, select the data source and choose from the saved queries you created.
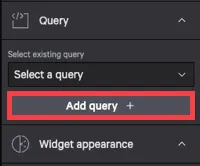
Choose the widget appearance (Data Table, Counter, etc.) for each query.
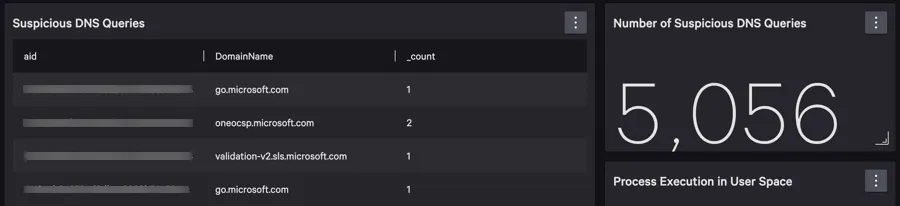
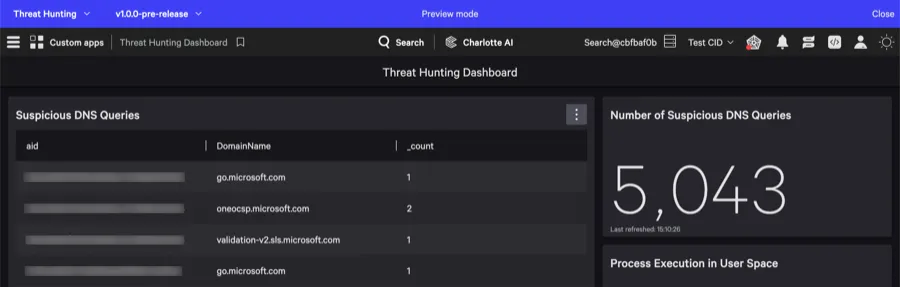
After adding all three widgets, your dashboard should display:
- Suspicious DNS Queries — a data table showing domains and lookup counts
- Number of Suspicious DNS Queries — a counter widget
- Process Execution in User Space — a data table showing process details
Configure navigation
Section titled “Configure navigation”To make the dashboard accessible from the Falcon console sidebar:
- From the Experience page, click the actions menu on your dashboard.
- Select Configure navigation settings.
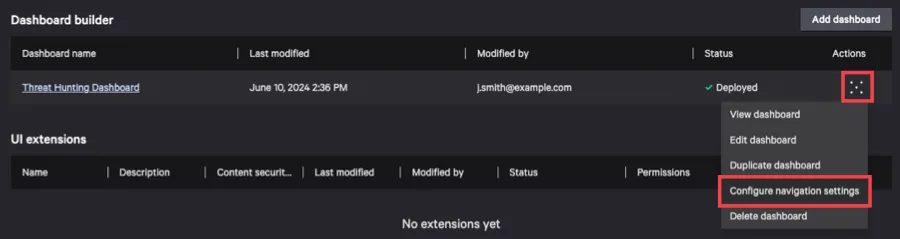
After configuring, a home icon appears next to the dashboard name indicating it has a navigation entry.

Step 4: Deploy and preview
Section titled “Step 4: Deploy and preview”- Click Deploy in the App Builder.
- Preview the dashboard in the Falcon console.
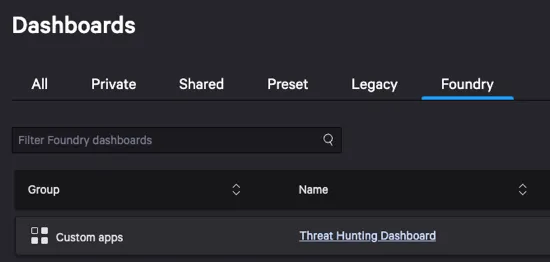
The dashboard appears under Custom apps in the Falcon console sidebar navigation:
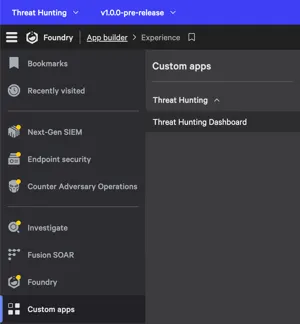
In preview mode, the dashboard displays live data:
Step 5: Create a workflow template
Section titled “Step 5: Create a workflow template”Create a workflow template that automates threat hunting by querying for suspicious activity across your endpoints and sending email alerts.
Configure the trigger and schema
Section titled “Configure the trigger and schema”- In the App Builder, go to Workflow templates.
- Click Create workflow.
- Set the trigger to Scheduled.
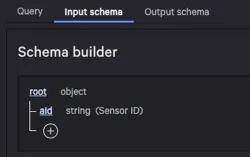
- Define an input schema with a
aidfield (Sensor ID) of type string.
Build the workflow
Section titled “Build the workflow”The workflow loops through sensor IDs, executes event queries for suspicious DNS activity on each device, evaluates conditions, and sends email notifications for matches.
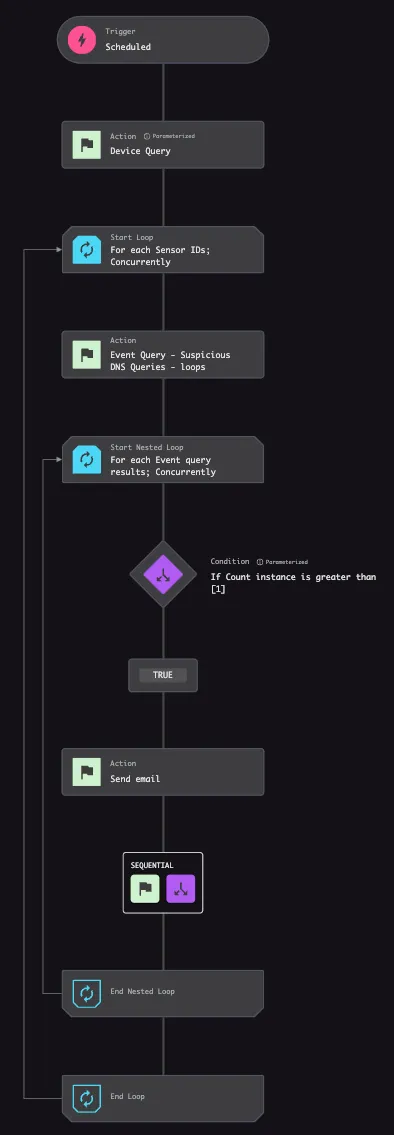
The workflow includes:
- A Device Query action to get sensor IDs
- A Loop iterating over each sensor ID
- An Event Query for suspicious DNS queries per device
- A Nested Loop over query results
- A Condition checking if the count exceeds a threshold
- A Send email action for matches
Step 6: Release and install
Section titled “Step 6: Release and install”- Click Release in the App Builder.
- Go to Foundry > App catalog.
- Click Install now on your app.
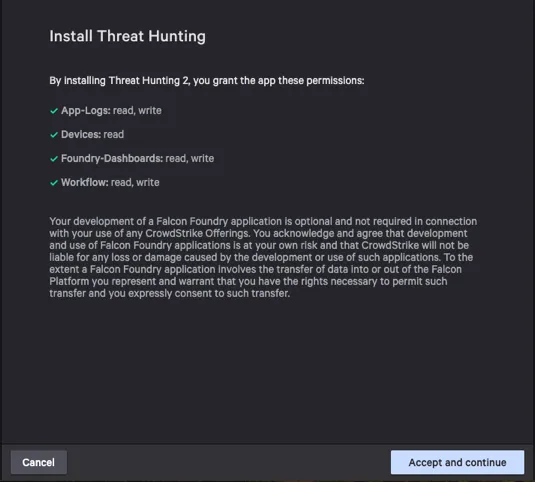
- Review and accept the required permissions:
Result
Section titled “Result”Your threat hunting dashboard is accessible from the Falcon console sidebar under Custom apps. Query widgets display live data from Next-Gen SIEM. The workflow template runs on your configured schedule and sends email alerts when suspicious activity is detected.
Next steps
Section titled “Next steps”- Add more widgets for specific threat hunting use cases
- Create additional workflow templates for different threat patterns
- Build a UI page for a more customized threat hunting experience